Getting started
Welcome to PlugTrader, where empowering your trading journey is just a few clicks away. Whether you're a seasoned trader or just starting, our tutorials will guide you through the key features of PlugTrader, ensuring you make the most of its powerful capabilities.
PlugTrader consists of 2 services:
- Creation of trading strategies.
- Deployment of strategies.
🚀 If you wish to directly launch the strategies, go to the Launch Strategies section.
Introduction
PlugTrader is a powerful software plugin designed for Metatrader 5 on Windows, revolutionizing your trading experience. This innovative tool empowers you to effortlessly create trading strategies without the need for prior knowledge. With over 1.3*10^23 possible combinations, PlugTrader's generator utilizes indicators, candle patterns, and seasonalities randomly to produce the most robust strategies.
Only the cream of the crop makes it through, thanks to the genetic algorithm and rigorous optimization criteria. PlugTrader ensures strategy reliability through Walk Forward Validation, eliminating concerns of over-optimization. It operates swiftly using OHCL price values, requiring only M1 data for validation and OHCL data.
Take control of your portfolio with PlugTrader's intuitive features. Visualize generated strategies, subject them to Monte Carlo tests, and analyze correlations between strategies. Customize your money management and risk preferences – whether fixed lots or percentages – and seamlessly manage multiple assets across various timeframes. PlugTrader goes beyond, offering key performance indicators, regular software upgrades, a personalized ranking formula, and more. Transform your trading strategies with PlugTrader and take charge of your financial journey.
Requirements
To unleash the power of PlugTrader, ensure your system aligns with the following prerequisites:
- Operating System: Microsoft Windows 2008/7/8/10 or higher
- Processor: SSE2-enabled processor (Pentium 4/Athlon 64 or higher)
- RAM: 256 MB or higher
- Hard Disk Space: 50 MB or higher
Please note that PlugTrader exclusively operates on the Microsoft Windows OS platform.
⚠ IMPORTANT: You need to install the MetaTrader 5 platform of your broker. To do this, you will need to go to your broker's website and search for something like Download MetaTrader 5 for Windows. Finally install it.
PlugTrader will only work with your broker's MetaTrader and not with the generic MetaTrader installation.
First Steps
To access the full suite of PlugTrader features, users must first register and select their account type. After email validation, users can log in, choose their license – either FREE, BASIC or PRO – each serving specific needs. The FREE license allows exploration of the software's potential, but with limitations.
Regardless, users are encouraged to test the software's capabilities. The FREE version caters to those uncertain about its functionality.
Download
To download the software, users can navigate to their profile and select License. Depending on the active license, a Download button will be available, providing seamless access to the chosen version.Credentials
Broker connection
PlugTrader needs access to some data from your broker, which is why for certain features, you will be prompted to connect your broker account with PlugTrader.
You will be prompted to enter your broker account number (real or demo), password, and the broker server.
Ensure MetaTrader is closed on your computer before connecting.
- You may have the MT5 terminal open. Close it and re-enter your credentials.
- Make sure you have installed the MetaTrader 5 from your broker, and not from any other source.
- It's likely that your MetaTrader is not installed in the correct path. Make sure you have it installed correctly (default path).
License connection
Additionally, to access all the features of PlugTrader, you must enter your license if you have a BASIC or PRO account. To do this, go to the Overview page of the PlugTrader software and you will see a window where you can enter your license. You can find your license in PlugTrader.co > Your User Profile > License.Generator
In the Generator section allows users to configure various parameters for the strategy generation process. This includes defining Trading Symbols, Leverage, Portfolio Balance, Training Data range, Period and other additional optional settings.
GENERATOR SETTINGS
Parameters
-
Symbols
Select all the assets you wish to include in your portfolio.
Some assets or symbols produce better strategies than others. The best results are obtained with forex and indices, while stocks typically do not yield many strategies. -
Leverage
Leverage for trading.
-
Period
Trading timeframe for the strategy.
Options: Various timeframes ranging from Monthly to M1 (Minute 1).Some traders argue that on shorter timeframes, market noise can be higher, making strategies more prone to generating false signals. Therefore, we recommend creating strategies with timeframes longer than 1 hour. -
Training Data
Amount of historical data in years that will be used to create the strategies.
Training trading strategies over extended periods is advisable for several reasons. It allows capturing diverse market conditions, enhancing the robustness and generalization of the strategy, reducing the impact of market noise, evaluating long-term performance, and building greater confidence in the strategy. -
Portfolio Balance
Initial balance for the trading account in dollars.
Additional optional settings
-
Sample Validation
IS-OOS Period refers to the process of splitting the data into an in-sample (IS) set for developing the strategy and an out-of-sample (OOS) set for evaluating its performance under previously unobserved conditions.
-
Variability
Enable/disable random variability between strategies.
Variability causes more different strategies but less quantity. -
Seasonality
Choose between All, Yes, or No for daily and/or hourly seasonality.
-
Order Type
Choose between All, Longs, Shorts, or Both for order types.
-
Risk
Choose between All, Volatility or Ratio(1:3) for risk calculation.
Volatility based on ATR and/or a 1 to 3 Ratio based on volatility, meaning Take Profit = ATR*3.
Note: It's not truly a fixed 1 to 3 ratio; it depends on the volatility at the time of placing the order. -
Indicator
Select a specific indicator for strategy generation.
Options: A variety of indicators to choose from.- All: Includes all available trading strategies.
- Trend and Breadth: Utilizes trend analysis and market breadth indicators.
- Band and Moving Average Crossover: Involves trading signals based on bands and moving averages.
- Parabolic SAR, Moving Averages, and RSI: Combines Parabolic SAR, moving averages, and the Relative Strength Index (RSI).
- ADX, MACD, and Zero Line Crossing: Incorporates Average Directional Index (ADX), Moving Average Convergence Divergence (MACD), and zero line crossing signals.
- Moving Average and MACD Crossover: Uses signals generated by the crossover of moving averages and MACD.
- Trend: Focuses on identifying and following market trends.
- Trend and Volatility: Considers both trend analysis and market volatility.
- Momentum and RSI: Relies on momentum indicators and the Relative Strength Index (RSI).
- Moving Average Crossover: Based on signals produced by the crossover of different moving averages.
- Engulfing Bullish & Bearish: Looks for bullish and bearish engulfing candlestick patterns.
- Bearish One Black Crowe: A bearish candlestick pattern indicating a potential reversal.
- Rising Window: Identifies a rising window pattern in price charts.
- IBS (Internal Bar Strength): Analyzes the strength of individual price bars.
- William Percentage Range: Utilizes the Williams Percentage Range indicator for market analysis.
Generate
Clicking the 🚀 GENERATE button submits the form for strategy generation.
A modal window will open, and you will need to wait until the main progress bar is complete to finish the generation.
Results
In the Results section, in the menu, you can explore and analyze the performance of trading strategies generated by the system. In this tutorial, we'll guide you through understanding the ranking and details provided for each strategy.
Ordered by %
Upon entering this section, you'll find a ranking of strategies based on their percentage return. This ordering helps you quickly identify the most successful and less successful strategies.
Step 1: Exploring Individual Strategies
- Each strategy is uniquely identified by its corresponding number.
- Strategies are categorized into:
- Best: The top-performing strategy.
- Good: Strategies that fall between the best and the worse.
- Worse: The least-performing strategy.
For each strategy, gain insights into the following details:
- Percentage Return: Indicates the percentage return achieved by the strategy, providing a quick overview of its profitability.
- Total Trades: The total number of trades executed by the strategy, giving you an idea of its trading frequency.
- Profit Factor: A key metric representing the relationship between gross profit and gross loss. Higher values suggest a more profitable strategy.
- Net Profit: The net profit generated by the strategy, reflecting its overall financial success.
- Profit Trades: The number of trades classified as profitable, indicating the strategy's ability to generate positive returns.
- Drawdown: A measure of the strategy's risk, showing the maximum decline in the account's balance.
Viewing Strategy Graphs
- Each strategy comes with a graphical representation of its balance versus time.
- The "out-of-sample" period is highlighted in green, allowing you to visually identify the performance during this specific period.
Step 2: Downloading Strategy and Report
-
Config/Strategy (
.setfile): Detailed information about the strategy, including its specific parameters and settings.You will need this file when deploying the strategy. -
Report (
.htmfile): Comprehensive report that provide in-depth analysis and insights into the strategy's performance (default Metatrader Report).To analyze the strategy in the next section (Analyzer), you will need the Report, which will allow you to compare and analyze it with other strategies.
Ordered by Ranking
In this section you have the power to customize strategy rankings based on your preferences. In this section, we'll guide you through the process of setting weights, understanding the ranking formula, and exploring individual strategies.
Step 1: Set Your Ranking Weights
-
Adjust the weights for "Profit Factor" (w1) and "Gain/Drawdown" (w2) to customize the ranking formula
Ensure the weights add up to 100, providing a balanced and accurate representation of your priorities.
- Apply Default or Custom Weights
Step 2: Explore Detailed Strategy Information
- Each strategy is assigned a ranking based on the customized formula.
- The ranking ranges from "Best" for the top-performing strategy to "Worse" for the least-performing strategy.
- For each strategy, gain insights into percentage return, total trades, profit factor, net profit, profit trades, and drawdown. For more information read the previus specifications
- The strategies are categorized as "Best," "Good," or "Worse" based on their ranking.
Step 3: Downloading Strategy and Report
For more information read the previus specifications
Analyzer
The following steps outline the process to follow in the Analyzer section.
This tool allows you to deeply analyze and gain insights from your Metatrader 5 trading reports, whether they are from PlugTrader or not. In any case, they have to be Metatrader 5 reports. This will also help you create a robust portfolio.
Uploading Reports
- Navigate to the "Upload & Update" section.
- Upload your
.htmor.htmlreports by dragging and dropping them here, or by clicking to select. - Click the Upload & Update button to initiate the analysis. To Delete a Strategy: Utilize the trash icon next to a strategy's name to remove it from the analysis.
Analyzing the Portfolio
Strategies Table
A table will be displayed with all the uploaded strategies, showing the details of each one. You will be able to sort them as you wish.
Portfolio Metrics
- Total Return ($): The aggregate profit or loss across all strategies in the portfolio.
- Volatility: Measures the variation in the portfolio's returns.
- Average Daily Profit ($): Average profit earned per day.
- Trades: Total number of trades executed.
- Maximum Drawdown ($): The most substantial cumulative loss from a peak to a trough.
- Winning Percentage: The percentage of profitable trades.
- Profit Factor: Ratio of total profit to total loss.
- Average Winning Trade ($): Average profit per winning trade.
- Average Losing Trade ($): Average loss per losing trade.
A comprehensive chart showcases the combined equity curve of the portfolio over time.
Strategies Correlation Matrix
This heatmap visualizes the correlation between different strategies in your portfolio:
-
Color Coding:
- Red: Strong negative or positive correlation (strategies move in opposite or equal directions respectively).
- Orange: Intermediate negative or positive correlation (strategies move in opposite or equal directions respectively).
- Green: Little to no correlation.
-
Scale:
- Values closer to -1 or 1 indicate a stronger correlation.
- Values closer to 0 indicate a weaker or no correlation.
Monte Carlo Simulation
The Monte Carlo Simulation provides a dynamic way to evaluate the performance of your trading portfolio by considering a range of potential market scenarios.
- The black line corresponds to your initial portfolio, while other colors represent simulation results.
- To pass the Monte Carlo test, ensure that 95% or more of the 50 simulations conclude with a positive balance. If the majority of simulations result in a positive balance, your portfolio is deemed robust and resilient.
Returns Chart
The Returns Chart enhance your trading strategy analysis. This chart visualizes the returns achieved with each individual trade, providing valuable information about the performance of your portfolio.
Assets Distribution Chart
The Assets Distribution chart provides a visual representation of the trading activity across different assets, aiding in the evaluation of portfolio diversification and asset-specific performance.
- The chart displays a circular representation of the various assets present in your portfolio.
- Each segment represents a different asset, and the size of the segment corresponds to the number of trades involving that asset.
🌠 Find The Best Combination
This feature allows you to automatically search for the best combination of strategies using our genetic algorithm.
The genetic algorithm optimizes the combination of strategies by seeking to maximize the R² value. It uses an initial population of solutions, iteratively selecting, crossing, and mutating the best solutions to find the combination that maximizes the model fit (R²).
Inputs
Population Size
Purpose: Determines how many solutions (individuals) are in each generation.
Adjusted Ranges:
- Small: 20-50 individuals
- Medium: 50-100 individuals
Number of Generations
Purpose: Defines how many times the algorithm will evolve the population.
Adjusted Ranges:
- Few: 50-100 generations
- Moderate: 100-200 generations
Number of Parents
Purpose: Specifies how many individuals are selected to mate and produce the next generation.
Adjusted Ranges:
- 10-30 parents (In this case, we can consider a smaller range due to the problem size)
Mutation Rate
Purpose: Indicates how often random changes are made to individuals to maintain genetic diversity.
Adjusted Ranges:
- Low: 0.01-0.05
- Moderate: 0.05-0.1
🌠 Launch Strategies
- Self Launch: Use your own Virtual Private Server (VPS) to host and run the strategies. Or/And
- Auto Launch: Launch the strategies directly through PlugTrader.
Self Launch
You can use your own Virtual Private Server (VPS) to host and run the strategies. This approach provides you with control over the server environment and the MT5 terminal.Steps
- Before starting, open the MT5 platform provided by your broker and log in using your credentials. Ensure you are in the terminal of MT5, logged into the specific demo or real account you wish to use.
-
In your MT5 program, navigate to Tools > Options > Expert Advisors. Check the Allow WebRequest for the following URLs: box and add
https://plugtrader.co/. -
Enable Algorithmic Trading (shortcut:
Ctrl + E).
Enable Algorithmic Trading - If you have not done so before, you must register the MetaTrader 5 account number you wish to use. To do this, go to the Self Launch section on the PlugTrader website at the menu. Enter the account number there.
-
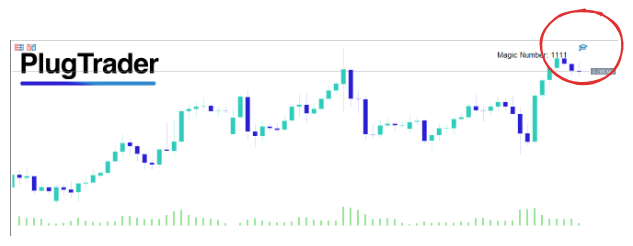
At your broker's MetaTrader 5, if you haven't installed the PlugTrader Expert Advisor, place the
PlugTrader.ex5file in the Experts folder. To locate this folder, in the MetaTrader file explorer, go to File > Open Data Folder > MQL5 > Experts. - At the MT5 terminal, drag the PlugTrader expert onto the chart of the desired asset and timeframe.
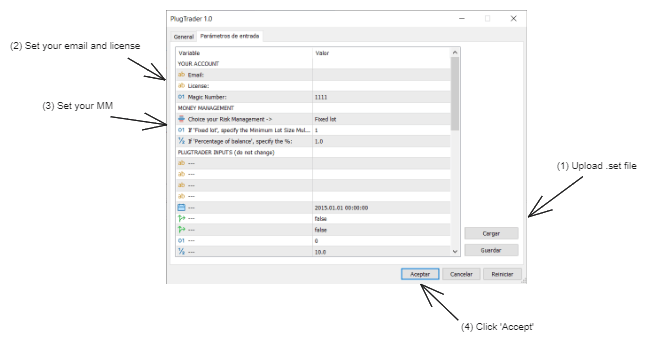
-
In the expert's settings, (1) upload the
.setconfiguration file downloaded for the specific strategy. (2) Ensure correct entry of your email and license in the respective inputs.
(3) Adjust the risk management as you desire.- Fixed lot: fixed lot size, calculated from input A.
- Balance percentage: lots are based on the specified percentage in input B.

Money Management in the expert configuration
Steps in the expert configuration
Finally, (4) click Accept to launch the robot
Auto Launch Beta
In PlugTrader, we make it easy for you to upload and launch your trading strategies in just a few clicks, without worrying about the server. Depending on the package you choose, you'll be able to deploy more or fewer strategies.Steps
- In PlugTrader website, go to Auto Launch.
-
First, you'll need to click on Add Strategy and there add the
.setfile you want to launch. You'll also need to set a name for your strategy. - Then, you'll have to launch the strategy through the launch button. Before launching, you'll be prompted to enter the strategy's "Period" and "Symbol". You'll also be asked to input your MetaTrader 5 account credentials with your broker. Remember that the credentials won't be stored.
- Finally, click on Submit to launch the strategy. After a few seconds, if everything is correct, your strategy will be launched. Otherwise, you'll receive an error message upon launch.
FAQ & Tips
When strategies are created, they are set with a fixed lot size and the minimum lot. For example, for EURUSD, they will be generated at 0.01 lots. However, if you want to change the risk of the strategy, you'll need to update the .set file. There are 2 options to do this:
Option 1
-
Go to Edit config (
.set) file at PlugTrader software menu. -
Load the Strategy's
.setFile -
Modify Money Management Parameters and Magic Number:
- Adjust the inputs related to Money Management according to your needs, and the Magic Number input.
Option 2 (manually)
-
Go to Your MetaTrader 5:
- Open MetaTrader 5 on your computer.
-
Drag the PlugTrader.ex5 Robot to the Chart:
- Drag the PlugTrader.ex5 robot to the corresponding chart (symbol and timeframe).
-
Load the Strategy's
.setFile:- At the bottom, go to the Input Parameters tab.
- Right-click on the parameter table and select Load.
- Choose the
.setfile of your strategy.
-
Modify Money Management Parameters:
- Adjust the rows related to Money Management according to your needs, and the Magic Number input.
-
Save the Updated
.setFile:- Once you've made the changes, right-click and select Save.
- This will be your new, updated .set file.
By following these steps, you can customize the risk management settings for your trading strategies to better align with your trading goals and risk tolerance.
Support
For further questions, including partnership opportunities, please email us to hello@plugtrader.co or contact us using our contact form.